The author has a strong interest in hardware and used JMeter to conduct load testing, documenting the process of deploying JMeter, InfluxDB, and Grafana on CentOS 7. They shared installation and command usage for JMeter, InfluxDB’s features and Docker installation method, as well as a simple deployment and configuration for Grafana. They summarized experience and references related to high-performance programming patterns.
Background
As widely known, I have a very strong interest in hardware. By chance, the test team was using JMeter to perform load tests and discovered that performance wasn’t improving. As a curious individual, I decisively took action to see how the company conducted its testing. There’s also a small story: at some point in the distant past, I read a post on OpenChina about how to create more impressive-looking performance test graphs – after observing Windows versions execute tests and achieving visualized TPS data display, what’s the use of configuring a web panel?
Thinking is all well and good, but you have to try it yourself to understand. Don’t use GUI mode for load testing! only for Test creation and Test debugging.
Background
Officially, it’s recommended to obtain test reports via the command line and display them using a GUI, which introduces data errors. I don’t have deep knowledge of JMeter – at least I found a reason to tinker with a Linux version console panel. The openchinese post’s core component deployment isn’t friendly; you need to follow their WeChat channel to download the required files, so as a young millennial, of course I used Docker instead. Basically, my server is located domestically, and accessing the overseas source addresses is very slow – at least using an image service, Alibaba Cloud has a free acceleration.
Regarding docker installation and deployment, this will not be elaborated on here; please refer to previous articles for recommendations.
The following content focuses on two main areas: setting up the basic test environment components and a simple explanation of each component.
JMeter
Apache JMeter is a Java-based load testing tool developed by the Apache Software Foundation. It’s used to perform stress tests on software, initially designed for web application testing but later expanded to other testing domains. It can be used to test static and dynamic resources, such as static files, Java microservices, CGI scripts, Java objects, databases, FTP servers, etc. JMeter can simulate massive loads from various stress categories to test the strength of servers, networks, or objects and analyze overall performance. Furthermore, JMeter can perform functional/regression testing on applications by creating scripts with assertions to verify that your program returns the expected results. To maximize flexibility, JMeter allows using regular expressions to create assertions.
Apache jmeter can be used to perform performance tests on static and dynamic resources (files, Servlets, Perl scripts, Java objects, databases and queries, FTP servers, etc.). It can be used to simulate heavy loads on servers, networks, or objects to test their strength or analyze overall performance under different stress types. You can use it for performance graphing or large concurrent load testing of your server/script/object.
Jmeter Deployment on CentOS7
Install the JDK runtime environment, download the Jmeter installation package:
yum install java-1.8.0-openjdk -y && \
wget https://mirrors.bfsu.edu.cn/apache//jmeter/binaries/apache-jmeter-5.4.tgz && tar -xf apache-jmeter-5.4.tgz
Configure environment variables:
export JMETER_HOME=$HOME/jmeter/apache-jmeter-5.4
export PATH=$JMETER_HOME/bin:$PATH
JMeter Commands
Finally, it will be connected to the Grafana dashboard, and you don’t need to input the -l parameter to observe data in the web console.
jmeter -n -t /tmp/order-500-10s.jmx -l /tmp/jmeter-order-report-20200109/order-500-10s.jtl
# Generally, don't use test results and test reports to simplify the command
jmeter -n -t /tmp/order-500-10s.jmx
InfluxDB
InfluxDB is an open-source distributed time series database written in Go. It requires no external dependencies. The database is now primarily used for storing large volumes of timestamped data such as DevOps monitoring data, app metrics, IoT sensor data, and real-time analytics data.
InfluxDB Features
InfluxDB’s features can be summarized into the following 9 aspects:
- Schema-less (Schemaless): Can contain an arbitrary number of columns;
- Metric Retention Time Setting: Allows setting the retention time for metrics;
- Support for Time-Related Functions: Supports functions related to time (such as min, max, sum, count, mean, median, etc.) for convenient statistical analysis;
- Storage Policy Support: Can be used for data deletion and modification (InfluxDB does not provide methods for deleting or modifying data);
- Continuous Query Support: Automatically scheduled sets of statements that run within the database, combined with storage policies to reduce InfluxDB’s system footprint;
- Native HTTP Support: Built-in HTTP API;
- Support for Similar SQL Syntax: Supports a syntax similar to SQL;
- Support for Setting Data Replica Count in Clusters: Allows setting the number of replicas for data within clusters;
- Support for Periodic Sampling of Data: Writes data to another measurement, facilitating granular data storage.
InfluxDB Docker Installation
mkdir influxdb && cd influxdb && \
docker run -p 8086:8086 -d --name influxdb -v $PWD:/var/lib/influxdb influxdb:1.7
docker exec -it influxdb /bin/bash enters the container, executes commands, and manually creates a database
root@bce0a55bbc72:/# influx
Connected to http://localhost:8086 version 1.7.10
InfluxDB shell version: 1.7.10
> Execute commands in the interactive shell
InfluxDB Database and User Creation
Create database: create database jmeter_t2
View databases: show databases
Switch to database: use jmeter_t2
Create user: create user "admin" with password 'admin' with all privileges
View users: show users
> show users
user  admin
----  -----
admin true
If the user permissions for admin are displayed as true, the database setup is complete.
Grafana
When writing test cases, it was found that the chart visualization effect is not very necessary; the tps data from the interface can be observed when executed in the command line, and more importantly, we wanted to know the internal timing of the program.
A simple deployment of the grafana console panel, importing a configuration file to connect with InfluxDB, was performed. The console supports filtering test results through tags; generally, only one InfluxDB database needs to be configured:
- Application Name
- Test Case Name
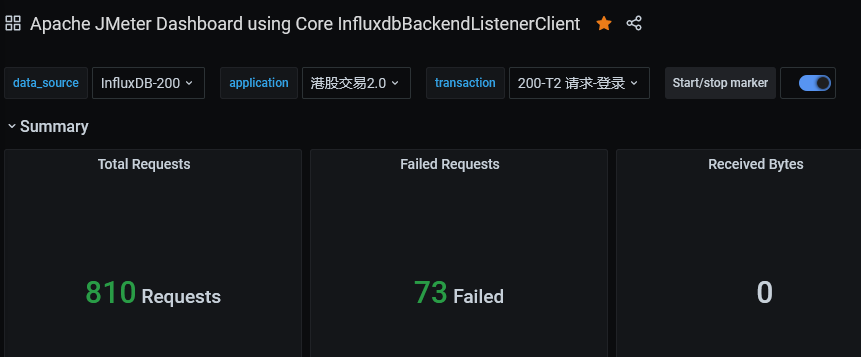
docker run -d --name=grafana -p 3000:3000 grafana/grafana:7.3.1
Due to the sampling interval in the web version, the calculated TPS and related values do not match the aggregated report from JMeter. Refer to this link for reference: https://www.vinsguru.com/jmeter-real-time-results-influxdb-grafana/
The documentation also describes how to customize the listener.
Epilogue
- High-performance program patterns invariably are one-loop thread; any locks, enqueueing, and dequeueing will cause unnecessary performance loss.
- The time spent on core business logic is greater than the time spent introducing other code, concurrency can effectively improve efficiency; if the core latency is sufficient, be cautious about introducing other code.